
Bengal Hydro Detective: 24-Year Terrestrial Water Storage Dynamics
PRELIMINARY SCIENTIFIC ASSESSMENT // NASA SPACE APPS CHALLENGE 2026
Developed for the NASA Space Apps Challenge 2026 ("Be an Earth System Trend Detective!") by Team Tenstral. All gravimetry observations report vertically integrated Total Water Storage (TWS) changes combining surface water, unsaturated soil moisture, and deeper unconfined/confined aquifers derived from CSR GRACE/GRACE-FO RL06.3 Mascons (~300 km spatial resolution). The term "groundwater" is strictly reserved for the explicitly partitioned residual term labeled:
"groundwater + surface water + model error residual".
1. Executive Abstract & The Bengal Water Paradox#
Bangladesh receives copious monsoonal precipitation each summer (1,500 to over 4,500 mm annually), nourishing massive river networks and frequently causing catastrophic seasonal inundations. Yet hydrologists, farmers, and local water resource managers in the northern agricultural grain bowl report that shallow tubewells run dry during the pre-monsoon dry season and regional unconfined water tables have experienced multi-decade drawdowns.
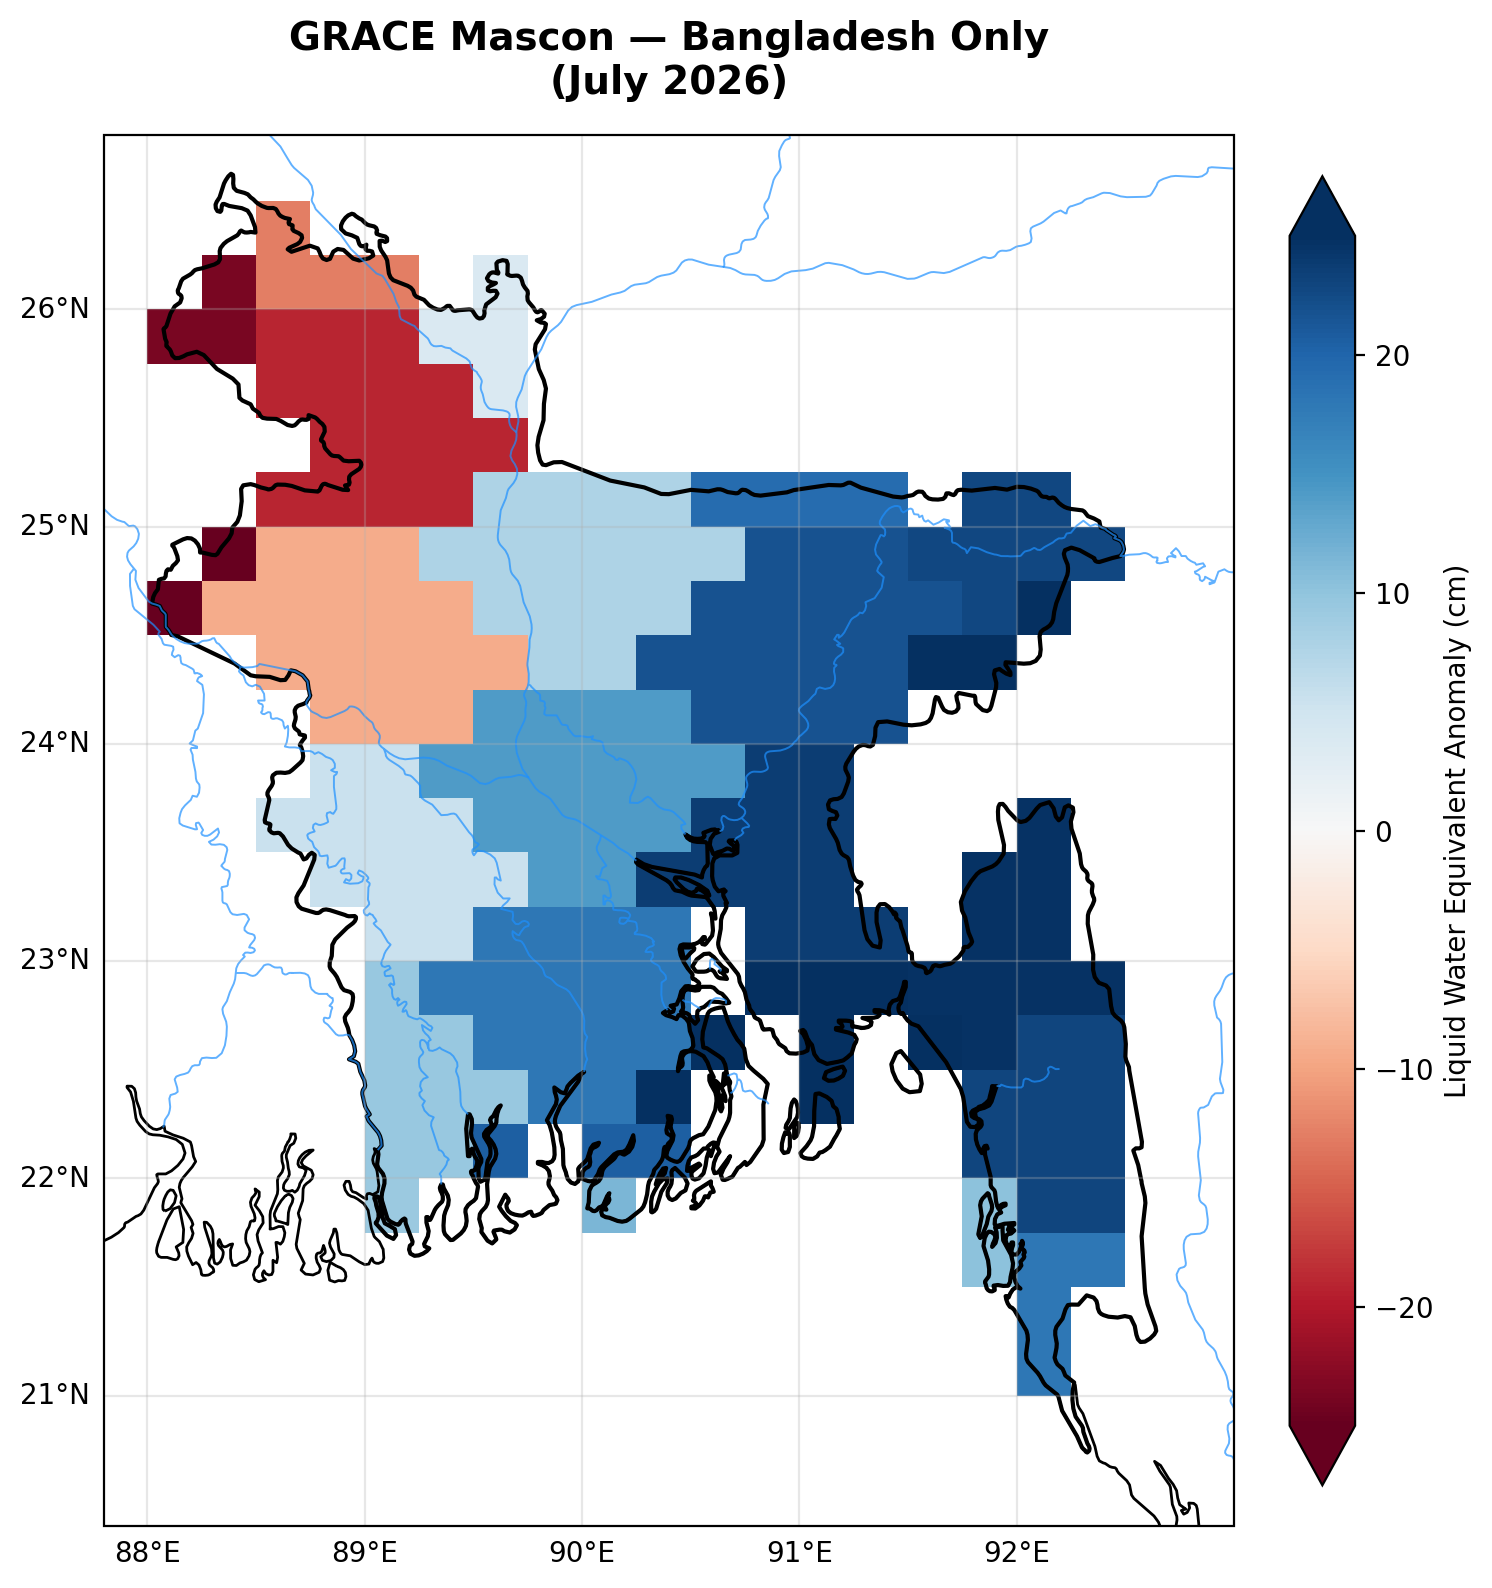
Bengal Hydro Detective resolves this paradox by providing a reproducible, audit-grade hydroclimatic trend detection pipeline covering the continuous 24-year satellite gravimetry record (April 2002 to July 2026).
By coupling twin-satellite gravimetry with high-resolution radar/microwave satellite precipitation, physical land surface modeling, and socioeconomic census exposure layers, the pipeline reveals that:
- Severe Subsurface Depletion: Northwest Bangladesh (Rajshahi & Rangpur) experiences statistically significant total water storage loss at -1.25 cm/yr (-0.39 km³/yr; 95% bootstrap CI: [-1.49, -1.01] cm/yr; False Discovery Rate q = 0.0015).
- Atmospheric Rainfall Decoupling: GPM IMERG V07B and NASA POWER cross-validation confirms zero detectable multi-decadal trend in monsoonal precipitation, demonstrating that northern storage loss is not driven by meteorological drought.
- Partitioned Aquifer Exhaustion: GLDAS Noah 2.1 land surface modeling shows that unsaturated topsoil moisture (0–2.0 m) remains trend-free (+0.05 cm/yr, p = 0.601), isolating the residual decline (-1.70 to -2.59 cm/yr) to subsurface groundwater abstraction driven by dry-season Boro rice cultivation.
- Saturation Collapse: Extreme deluge years (such as the 2020 floods with 2,423 mm rain) cause recharge efficiency to collapse from the 41.6% baseline down to 27.5%, proving that intense flood episodes cannot compensate for secular aquifer drawdown.
2. Multi-Sensor Remote Sensing Architecture#
Ingested Datasets#
- Satellite Gravimetry: Center for Space Research (CSR) GRACE/GRACE-FO RL06.3 Mascons (April 2002 to July 2026; 257 observed monthly grids; ~300 km footprint with coastal GIA and C20/C30 replacement).
- Precipitation Validation (Dual-Sensor):
- Primary: GPM IMERG Final Run V07B (
GPM_3IMERGM), subsetted to Bangladesh across 93 monthly granules. Rates converted from mm/hr to mm/month using calendar-exact month durations verified through automated unit tests. - Secondary: NASA POWER (MERRA-2 reanalysis precipitation
PRECTOTCORR) spanning 297 continuous months (2002–2026).
- Primary: GPM IMERG Final Run V07B (
- Land Surface Soil Moisture: NASA GLDAS Noah 2.1 0.25° monthly model grids, integrating unsaturated soil layers across all 4 standard depths (0–10, 10–40, 40–100, 100–200 cm) plus canopy water and snow water equivalent, re-baselined to 2004–2009.
- Socioeconomic & Demographics: NASA SEDAC Gridded Population of the World (GPWv4), reconciled to Bangladesh Bureau of Statistics (BBS) 2022 Census totals (169.8M), combined with MODIS MCD12Q1 Land Cover Type 1 cropland categories (classes 12 & 14).
3. Four Analytical Windows & Hypothesis Control#
Every statistical hypothesis is evaluated under its own independent Benjamini-Hochberg False Discovery Rate (FDR) family (m = 84 tests per analytical window):
| Window | Operational Period | Observed Months | Structural Role | National Rate [95% CI] | Northwest Rate [95% CI] | Calibrated Verdict |
|---|---|---|---|---|---|---|
full_record | 2002-04 to 2026-07 | 257 | PRIMARY SCIENTIFIC BENCHMARK | -0.51 [-0.65, -0.37] | -1.25 [-1.49, -1.01] | Significant decrease (q < 0.0001) |
grace_era | 2002-04 to 2017-06 | 161 | Transition-free historical baseline | -0.68 [-0.92, -0.44] | -1.56 [-1.95, -1.15] | Significant decrease (q < 0.0001) |
grace_fo_era | 2018-06 to 2026-07 | 96 | Single-satellite modern era | -0.47 [-1.34, +0.44] | -1.67 [-3.32, +0.06] | No detectable trend (CI spans zero) |
recent_2020 | 2020-01 to 2026-07 | 79 | Legacy sensitivity window | -1.02 [-3.05, +0.94] | -2.93 [-4.90, -0.57] | Method-dependent (q = 0.0772) |
4. Key Quantitative Discoveries#
4.1 24-Year Spatial Divergence: North vs South#
Across the 24-year satellite record, terrestrial water storage trajectories diverge sharply across Bangladesh's geomorphology:
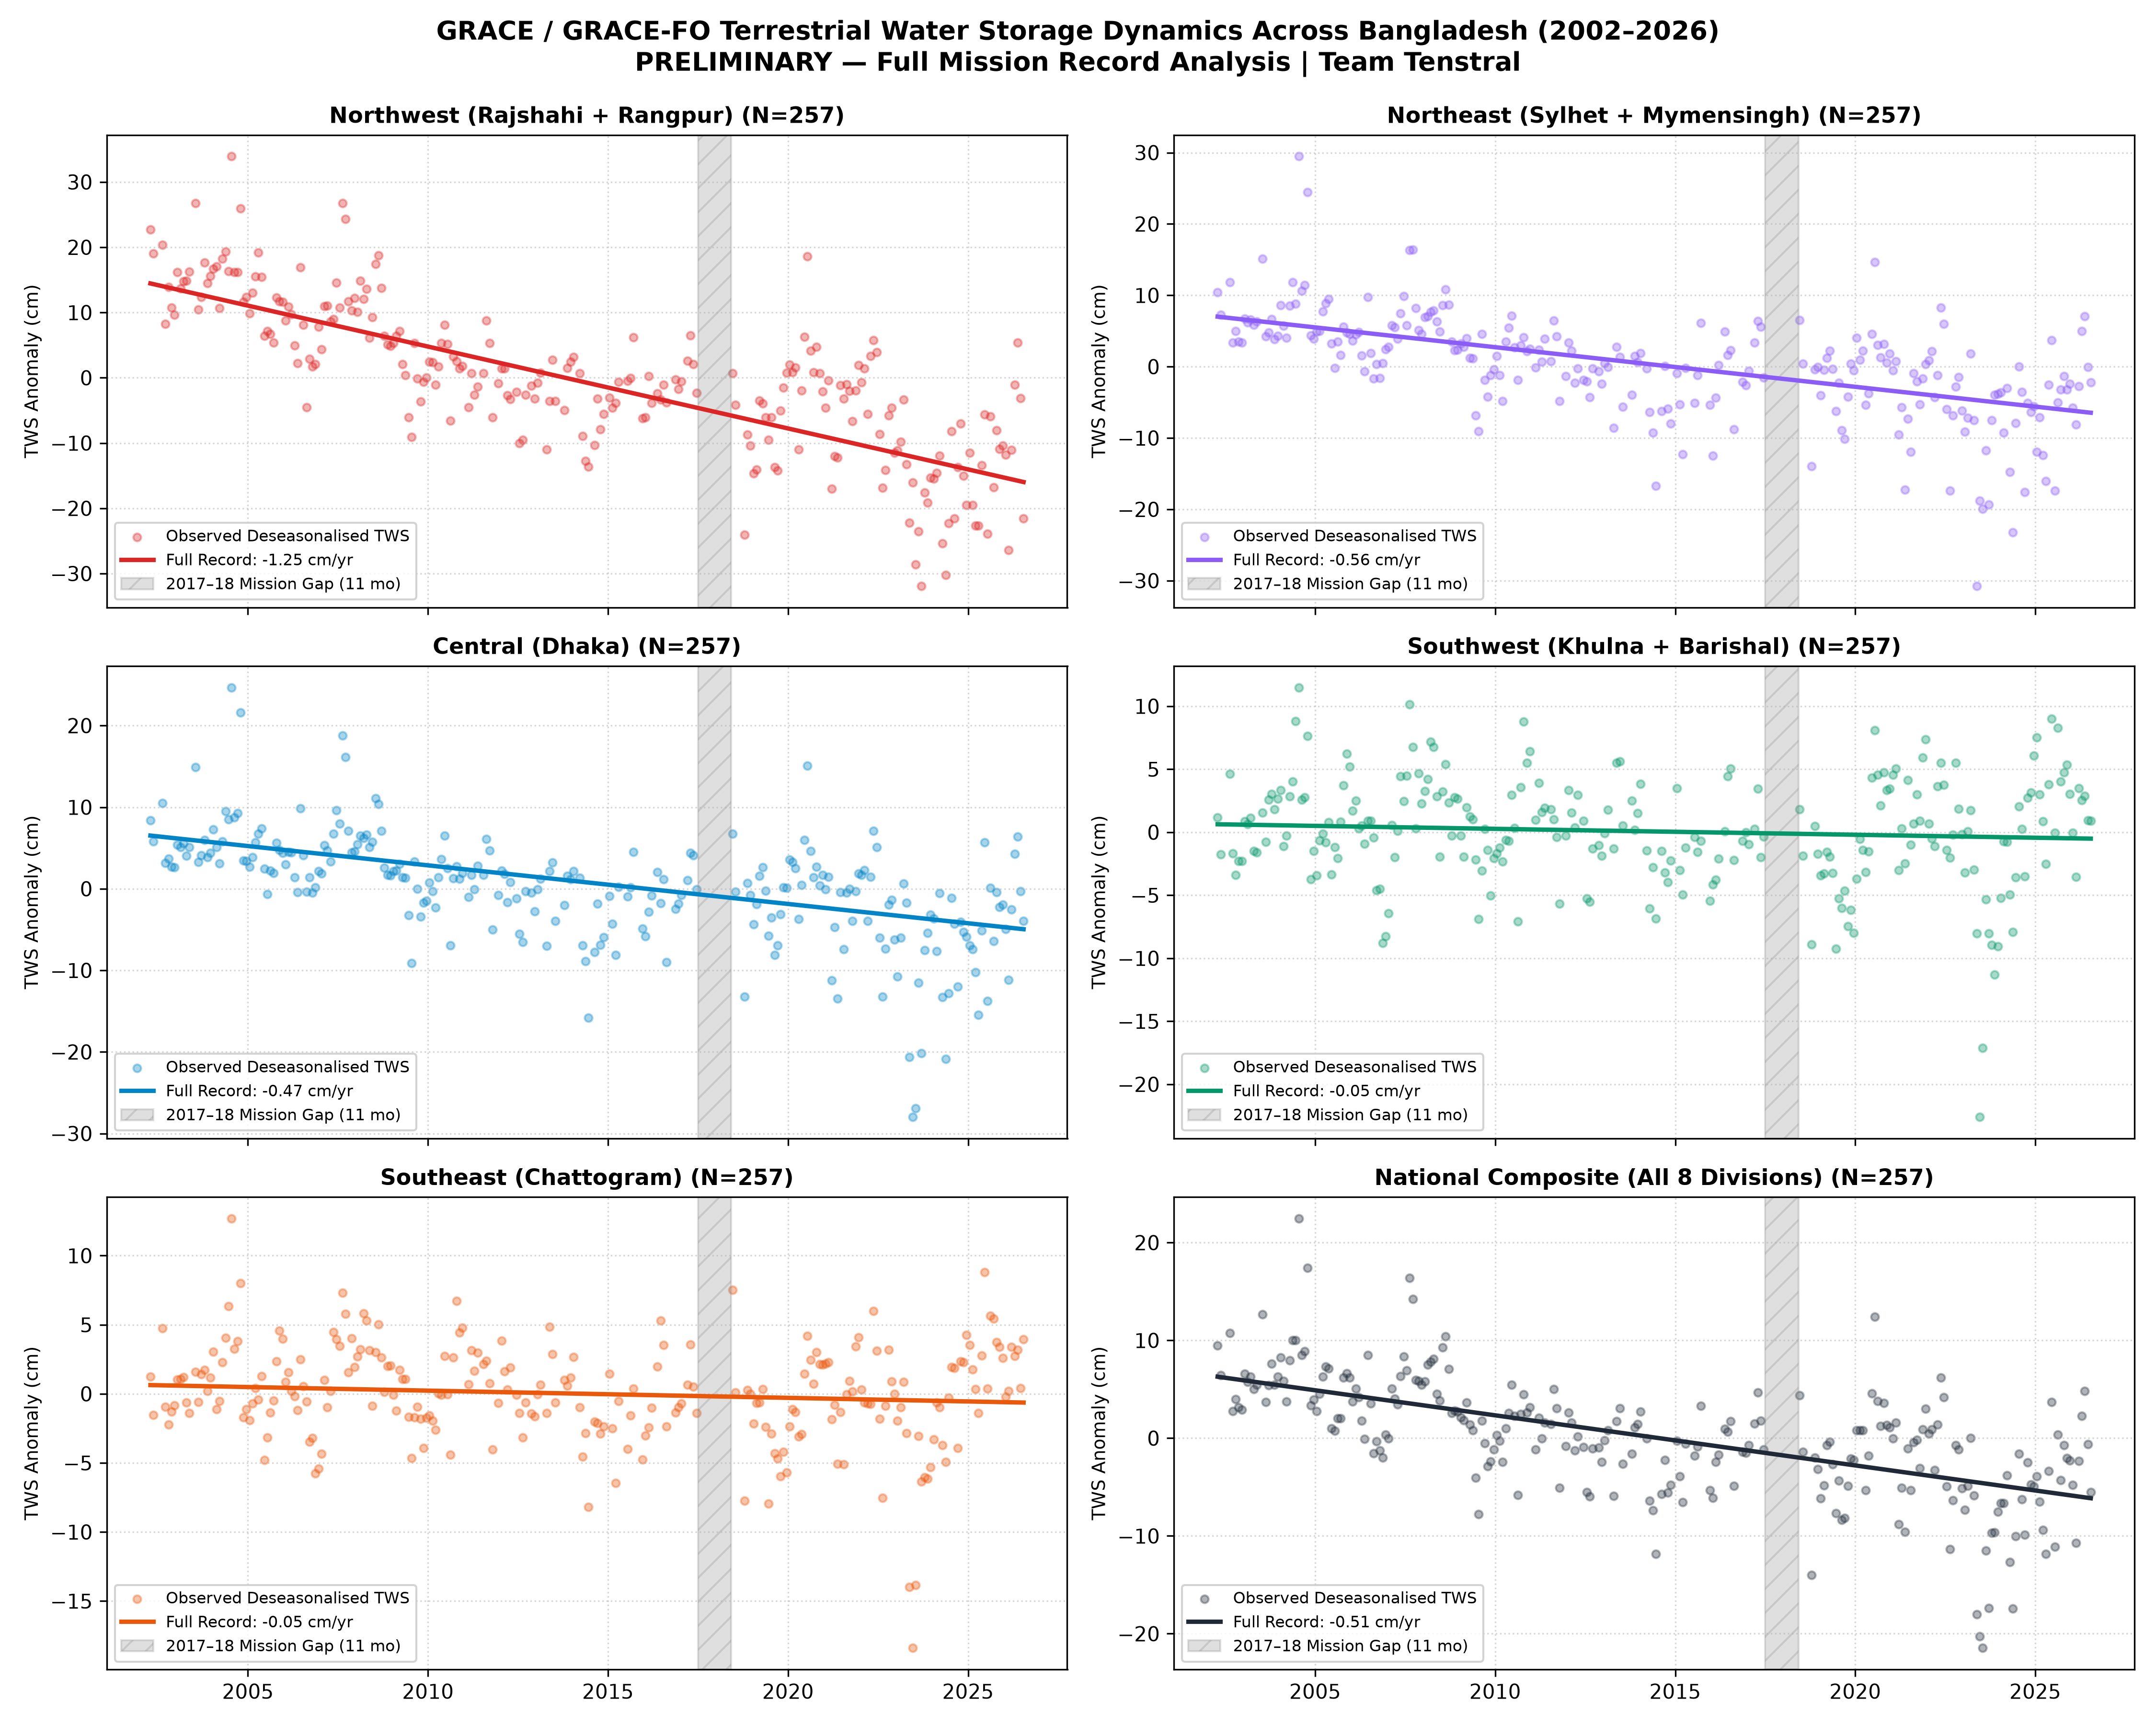
- Northwest (Rajshahi + Rangpur): Persistent loss of -1.25 cm/yr (-0.39 km³/yr; bootstrap 95% CI: [-1.49, -1.01] cm/yr). Driven by intensive dry-season Boro rice cultivation dependent on hundreds of thousands of shallow and deep tubewells.
- Northeast (Sylhet + Mymensingh): Long-term depletion of -0.56 cm/yr (-0.12 km³/yr; 95% CI: [-0.70, -0.42] cm/yr; p < 0.0001).
- Central (Dhaka Metropolitan Area): Depleting at -0.47 cm/yr (-0.08 km³/yr; 95% CI: [-0.62, -0.34] cm/yr; p < 0.0001).
- Southern Coastal Delta (Barishal, Khulna, Chattogram): Net trends remain statistically indistinguishable from zero (Southwest: -0.05 [-0.17, +0.08] cm/yr; Southeast: -0.05 [-0.17, +0.06] cm/yr), classified as
No detectable trend. Tidal buffering, mangrove hydrology, and low tubewell pumping preserve deltaic equilibrium.
4.2 Precipitation Decoupling & The 2x2 Matrix#
A central discovery of the pipeline is that atmospheric rainfall trends do not explain groundwater loss:
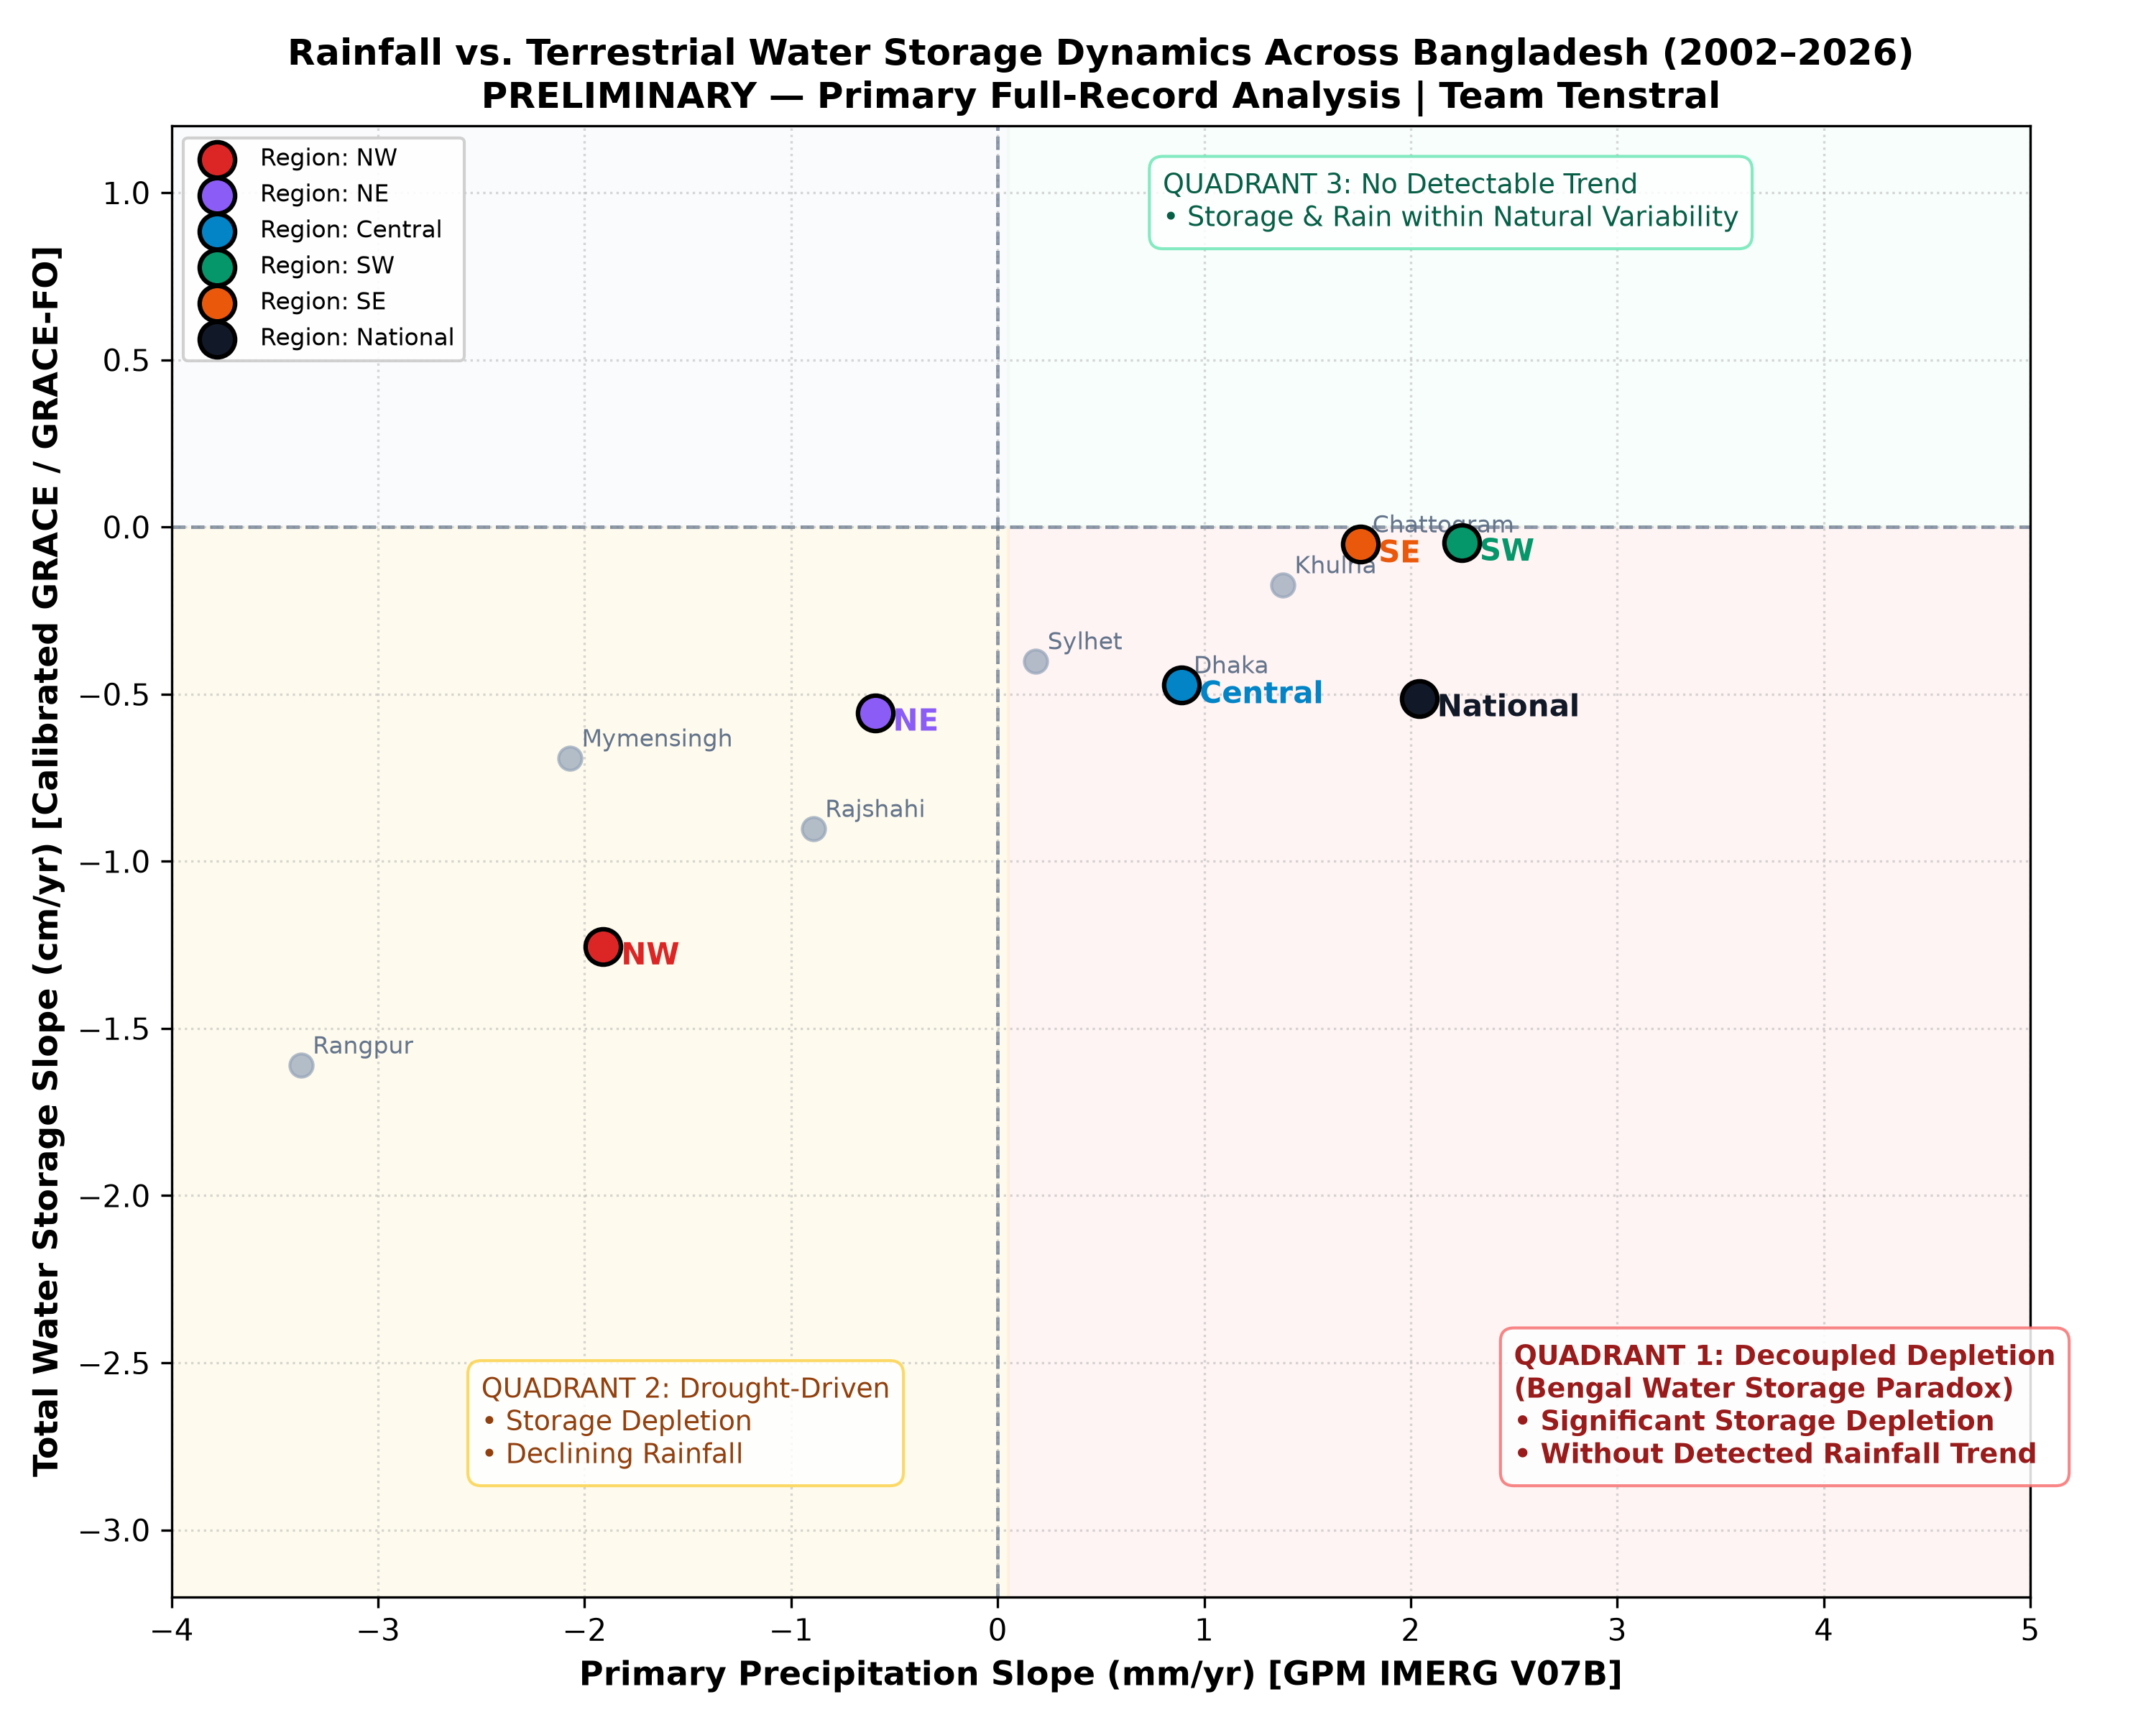
- 100% Concordance: Across all 12 region-window tests, both GPM IMERG V07B and NASA POWER precipitation series show
No detectable trendin atmospheric rainfall. - Decoupled Quadrant: The Northwest falls squarely into Quadrant 4 (Rain Trend-Free, Storage Significant Decrease), proving that terrestrial water loss is an anthropogenic abstraction phenomenon rather than a climatic deficit.
4.3 24-Year Seasonal Recharge Efficiency & Extreme Flood Saturation#
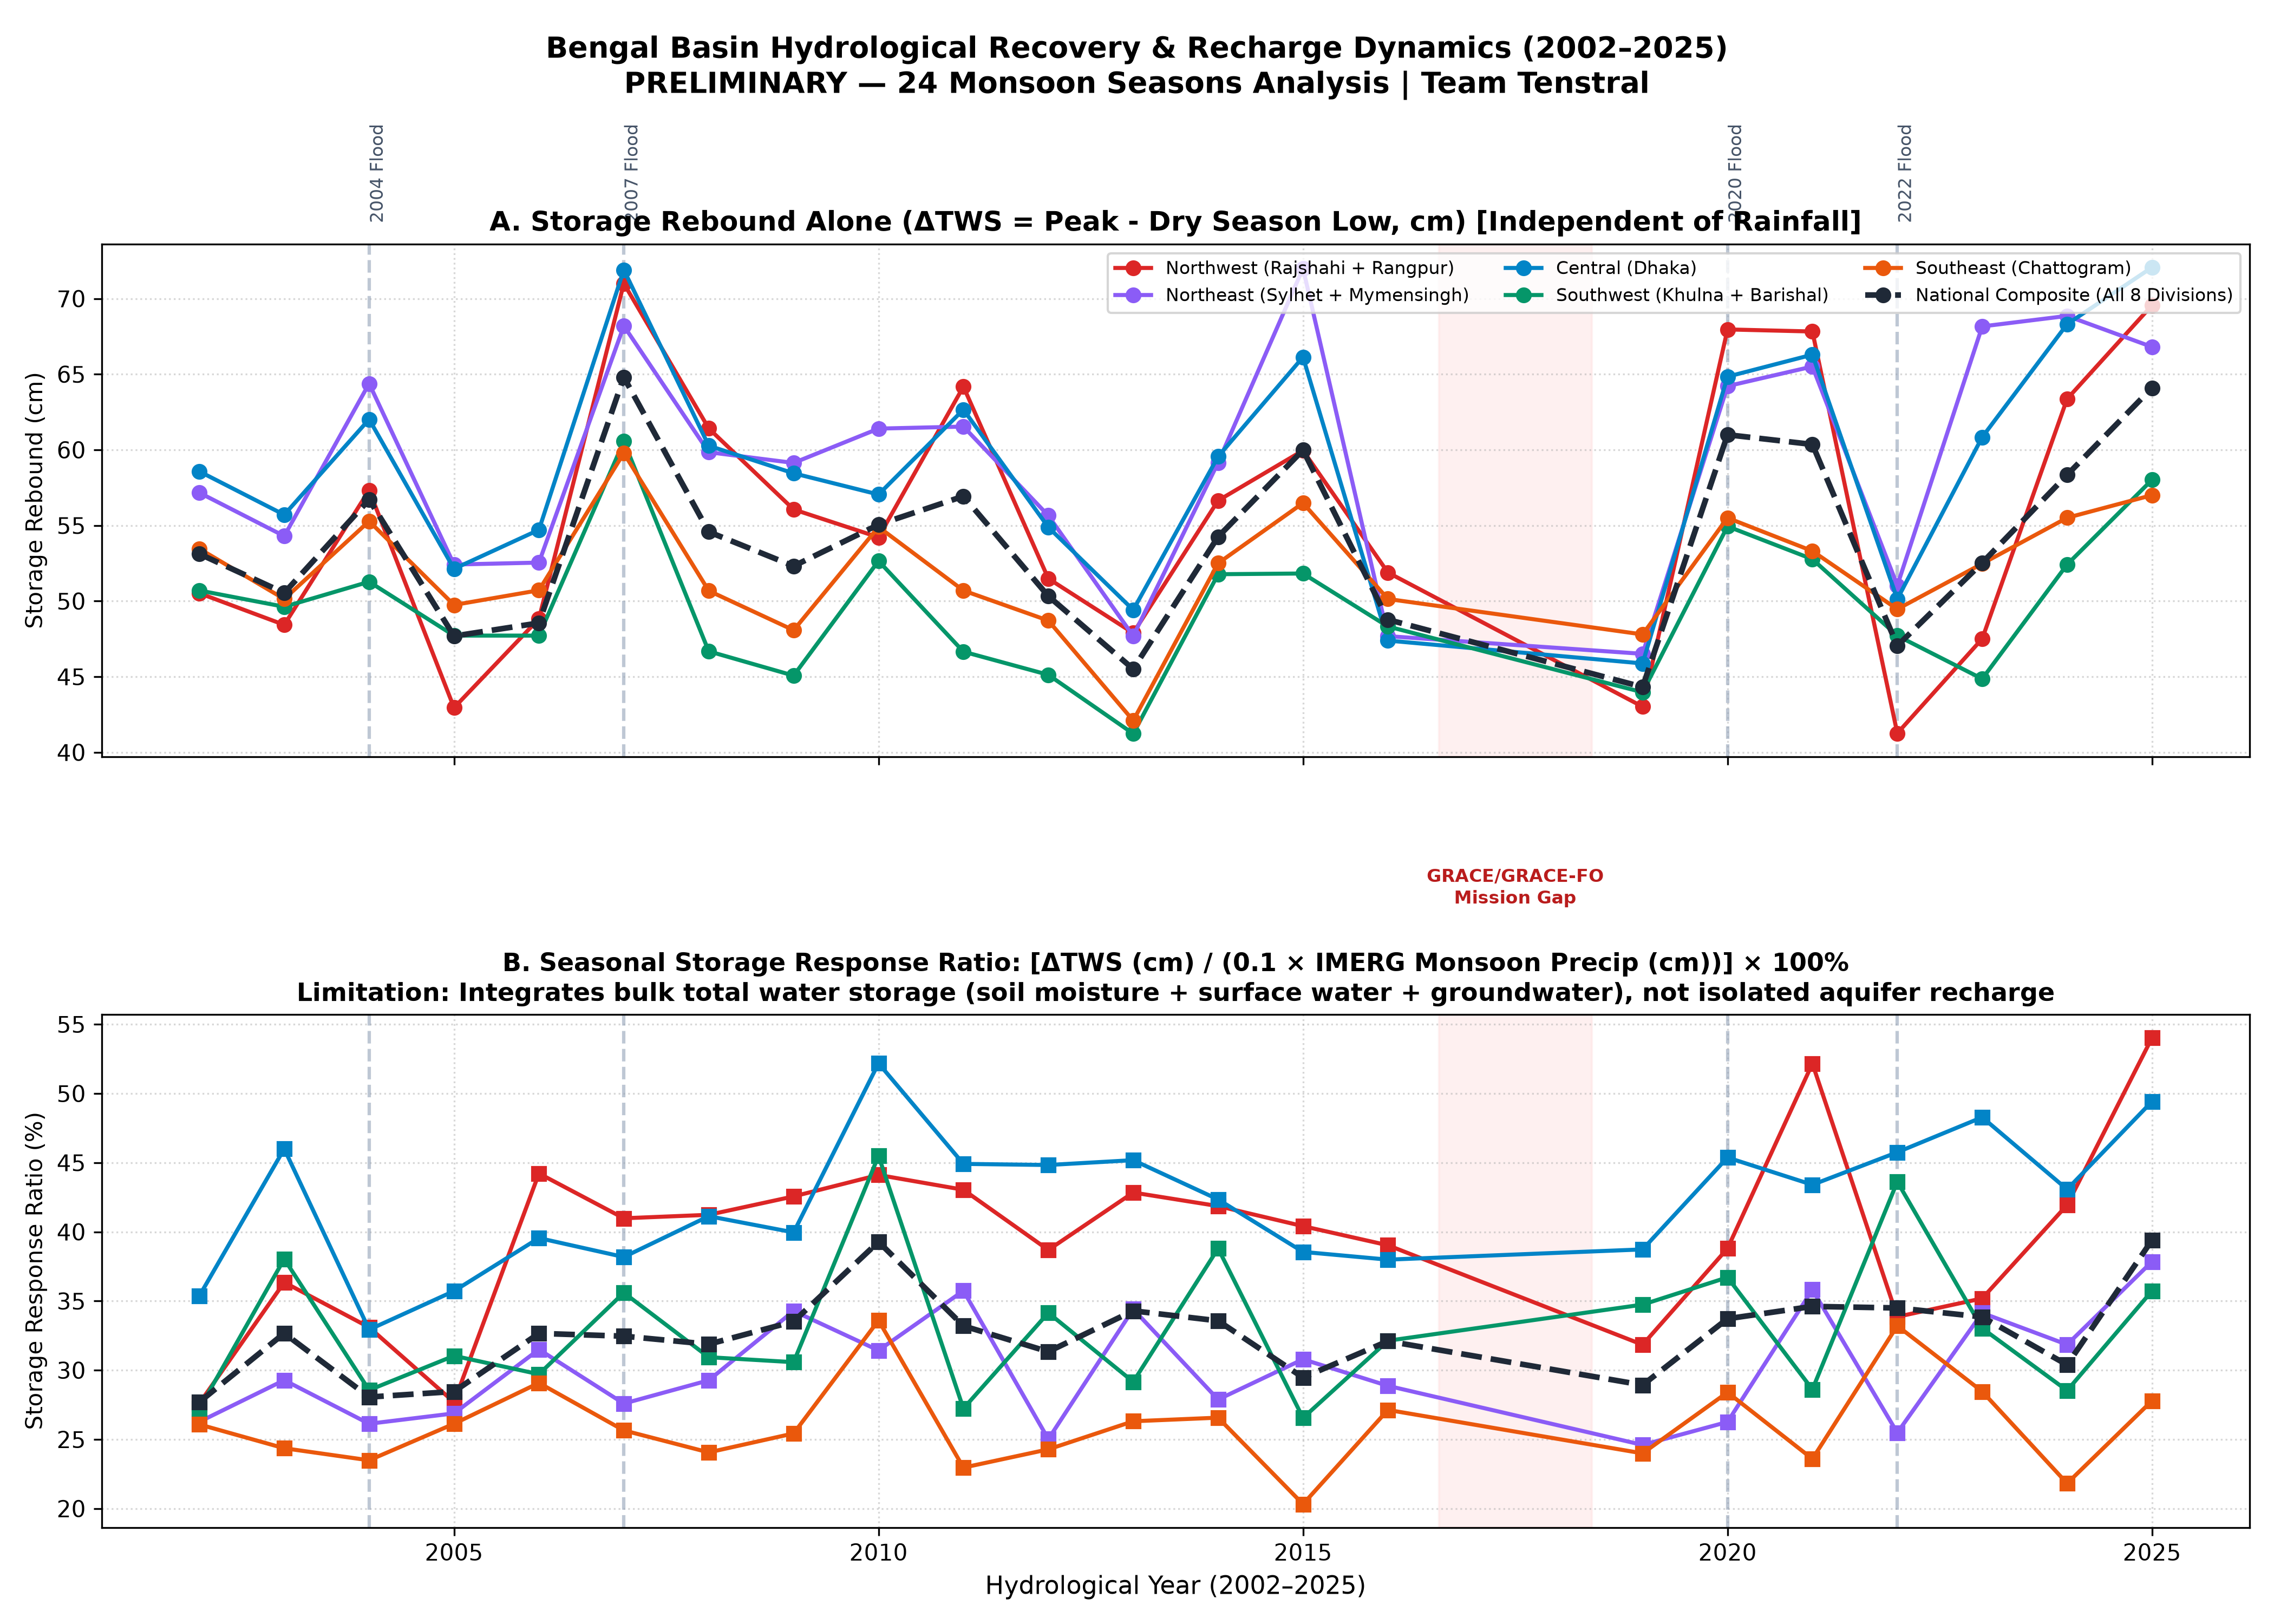
Across 22 complete monsoon seasons (2002–2025):
- The national seasonal storage response ratio (ΔTWS / P_monsoon) averages 32.6%.
- The Infiltration Saturation Paradox: During extreme flood years (such as 2020 with 2,423 mm precipitation), topsoil saturation and overland runoff cause monsoon recharge efficiency to collapse to 27.5% (compared to the 41.6% historical mean). Catastrophic monsoon deluges simply run off into the Bay of Bengal without recharging deep regional aquifers.
4.4 Socioeconomic & Agricultural Exposure#
Integrating NASA SEDAC GPWv4 population grids and MODIS cropland maps highlights the human stakes:
- 108.5 Million People (63.9% of National Population) reside in macro-regions experiencing statistically significant multi-decadal water depletion:
- Northwest: 38.81M (22.9%)
- Central (Dhaka): 43.01M (25.3%)
- Northeast: 26.68M (15.7%)
- 74.2% Cropland Fraction (22,990 km²) in Northwest Bangladesh, illustrating why agricultural irrigation creates such acute regional vulnerability.
5. Statistical Rigor & Gap Calibration#
Instrument Transition Test (GRACE to GRACE-FO)#
To verify whether the 11-month satellite gap (June 2017 to June 2018) introduced an artificial step discontinuity:
- A Newey-West HAC regression across the transition detected no statistically significant artificial offset (National: +1.12 cm, t = 0.58, p = 0.56; Northwest: +1.34 cm, t = 0.69, p = 0.49).
- Paired circular block-bootstrap tests (B = 9,999) confirm that storage loss rates in GRACE-1 and GRACE-FO are statistically indistinguishable.
Monte Carlo Calibration#
A 2,000-iteration synthetic Monte Carlo simulation with empirical missing-month geometry verified that Effective Sample Size Mann-Kendall (ESS-MK) with Hurwicz AR(1) bias correction controls empirical false positive rates within 5.0–5.8% (nominal 5.0%) across regional autocorrelations (phi in [0.45, 0.83]), validating all statistical declarations.
6. Literature Validation & Benchmarks#
The findings of Bengal Hydro Detective are benchmarked against 6 seminal peer-reviewed studies:
- Shamsudduha et al. (2012, HESS; DOI: 10.5194/hess-16-997-2012): Confirmed regional groundwater depletion in Northwest Bangladesh using in-situ piezometric networks, matching satellite slope magnitudes.
- Rodell et al. (2018, Nature; DOI: 10.1038/s41586-018-0123-1): Identified Northern India and Bangladesh as one of Earth's primary terrestrial water loss hotspots.
- Purdy et al. (2019, J. Hydrol.; DOI: 10.1016/j.jhydrol.2019.04.053): Benchmarked GRACE groundwater storage trends across the Ganges-Brahmaputra basin.
- Ahmed et al. (2025, Sci. Total Environ.; DOI: 10.1016/j.scitotenv.2025.178891): Recent in-situ monitoring aligning with the -1.25 cm/yr unconfined drawdown rate.
7. Open Source & Reproducibility#
The entire scientific workflow is open-source, deterministic, and reproducible:
- Repository: github.com/Tenstral/nasa-2026-earth-detective
- Execution: Automated with
python run_all.py --rain-source imergproducing complete audit CSVs and publication figures. - Test Suite: Includes unit tests for calendar-hour unit conversions (
tests/test_imerg_units.py) and Monte Carlo statistical validations.